
Let’s say you’ve just stepped into an analytics role at a good-sized company and you want to prove to all and sundry that they made an excellent choice.
We all know that after three months, your special status as “the new kid on the block” has faded and you are just another employee. So, what can you accomplish in 90 days?
 That was the question Xavier Colomés addressed while presenting at the eMetrics Summit
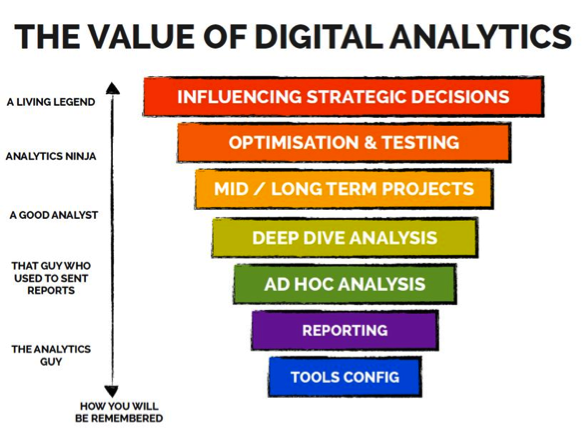
Here’s what he suggested in order to be seen by the different areas of the company as a leader of change and as a strategic business partner within three months. If your goal is to be known as a living analytics legend, you’ll need to move fast.
 If you want to make a substantive difference as soon as possible, start your first week working to understand the business, the company’s business model, the product, the industry and the company website.
This website review is essential as it is the last time you can review it as an outsider – as close to how a customer would see it as possible. Very soon, you will be too close and know too much. You needed to appreciate the customer journey before getting to know the company too well.
At the same time, study the organization, building a score card of the players, the hippos and the people with their hands on the budget. Be determined to understand everyone´s goals so you could help them achieve their business unit goals without introducing new complexities into their processes.
Dedicate your second week to creating your plan. Craft a personal vision and mission of the analytics role as you want it to be. What are your personal goals for this job and what does the ideal outcome look like? Present your plan to key stakeholders to convince them to buy in and be very careful to set the proper level of expectation. You want them to know what you can produce, but you also want them to know what it will take in terms of resources. Remember to always under promise and over deliver.
Spend week three with a pick and shovel – it’s time to get down and dirty with the tools. Make sure you have the proper tool set (clickstream, testing, usability and voice of customer) and that they are properly installed, implemented, configured and tagged. This is the foundational step toward data credibility, and once you have an understanding with your colleagues about their needs and your abilities, you need to be sure the data is trustworthy.
 The fourth week should be dedicated to confirming the prior week’s work – validating basic clickstream data with multiple tools and corroborating traffic attribution with outside sources like AdWords and affiliate programs.
Carefully debug all processes and verify that they were tracking all devices in all browsers and absolutely every page of the website. Make sure testing and surveying tools do not conflict and that you understand their dependencies.
Don’t forget to spend some time substantiating that the company is in compliance with local laws regarding personally identifiable information.
To avoid being caught in an endless cycle of unraveling data confusion, address the automation of a rock-solid extract-transform-load process. Your sixth week should be dedicated to basic plumbing – simply getting the various datasets to talk to each other.
Once the data can be trusted to flow on its own, turn to the creation and automated population of the most important reports and dashboards. This requires understanding corporate culture – discovering the critical few KPI’s and understanding local definitions and conventions. Does the week start on Sunday or Monday? What does “seasonality” mean to this company? Dedicate some time to setting up alerts, another thing that requires cultural insight. What is alarming to one company (or even a department) is not the same everywhere.
Week seven takes this process a step further by automating the reporting required by key stakeholders in the company from the C-Suite to product managers to testing specialists. This requires the skills of a detective, figuring out which reports are traditional but not useful and which new reports might actually be valuable – and then automating their creation and delivery.
Having arrived at week number 8, with all your ducks in a row, it’s time to educate your colleagues in the fine art of consuming data and using it to make business decisions. Make sure they understand statistical significance and confidence intervals. Train them to be able to do basic reports and exports to Excel. This may require lunch-and-learn events or more formal workshops.
Once they understand what analytics is – and how it helps them do their jobs and reach their goals – they will engage and start to depend on your data and your insights. Make sure to promote every quick-win that comes along to show the rest of the organization that you are making progress and they can enjoy the fruits of your labors as well.
Now that you’ve reached week number nine, you can delve into the data itself and start a comprehensive analysis. Draw the customer funnel or buying process starting from the beginning: Awareness, Acquisition, Engagement and Conversion.
Think of this as a general customer journey review, analyzing traffic sources and devices across channels, site search terms, heat maps, etc. This is also the time for some competitive analysis to understand where your company fits in the marketplace.
This is your chance to get some essential and practical feedback. A lot of your work has been built on top of assumptions about what you have learned in the prior weeks. Show your analysis to your colleagues to confirm you are on the right track and headed in the right direction.
Week ten will be your week of segmentation. The data is trustworthy, the reports are automated, your overall approach is on track. Now it’s time for some discovery, and the first step is to segment your prospects and customers. This is where actionable insight begins, because everybody may be different, but they are bucketable.
Segment in as many ways as make sense, and that includes segments aligned with the business strategy, segments by visitor intent (check your voice of customer tools for that), segments by branded vs. not- branded traffic, segments by device, segments by geography, etc., etc.
 Xavier recommends spending your 11th week on your voice of customer data. This is a rich set of first-hand input that initially will reveal problems that you haven’t found via data. You can then use data to see how endemic each problem is – and whether the fixes you have implemented have solved them.
Voice of customer should also include focus groups, face-to-face interviews, usability studies and direct observation. Get out from behind your desk and go see what customers are actually doing, as opposed to what they are telling you they are doing.
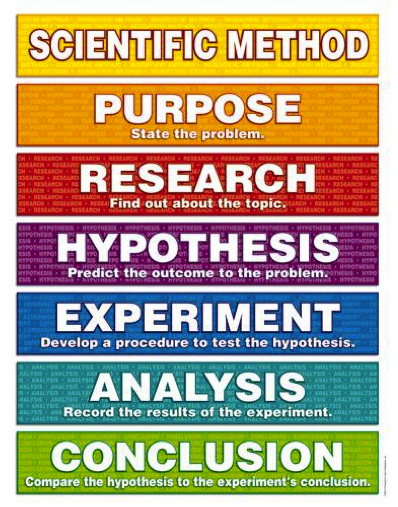
You have now reached week twelve and it’s time to create an ongoing testing methodology. This is where you establish a rigorous testing plan and educate others in how to formulate a valid hypothesis and formally test it to the exclusion of opinion and cognitive bias.
In his recap, Xavier implored the eMetrics Summit audience to remember that the goal of the digital analyst is to lead change, and that the value of the analysis relies on the outcomes of actions taken. He implored them to automate everything that takes time away from the organization’s main goals but to make sure that those who receive automated reports understand them well enough to really make use of them.
Xavier’s desire was to map out a 90-day plan so that the new-kid-on-the-block analyst could get to testing and deep-dive data discovery as soon as possible.
It may seem ambitious, but at least it points in the right direction to making your first 90 days really count.
By Jim Sterne, Founder, eMetrics Summit
 |
 |
 |
 |


Data Driven Business © 2014 • 100 Waverly Street • Ashland, MA 01721
![]()